What are the benchmarks for online registration rates and digital subscriptions? More and more consumer and B2B publishers are constructing their digital content to maximise free registrations and create a funnel to convert to paid digital subscriptions. But how do you know what stop rates and conversion rates you should be targeting?
I have collected detailed stats from several publishers breaking down how their registration and subs funnel works. They now have detailed insights on exactly which parts of their website are on track and where they need to improve. Others wanted to participate but their systems didn’t allow them to track the data.
This article explains the key measures you need to track to optimise your conversion of free visitors to paid subscribers, and the range each measure should fall within.
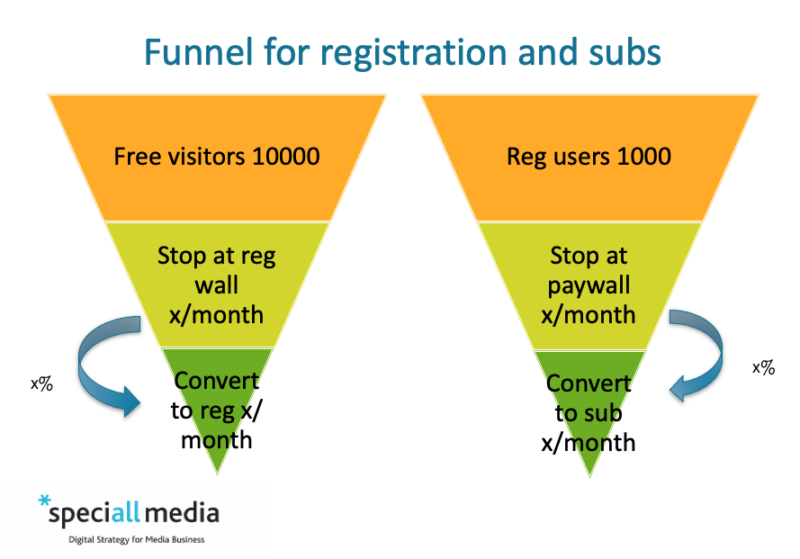
How many free visitors are hitting your registration wall each month? (stop rate)
This is the first gate in your funnel. If visitors can navigate your site without hitting a reg wall they will never see the need to register. Of course some content you may wish to keep outside even a reg wall – possibly news, sponsored content and any articles you are heavily promoting on social media. The received wisdom is that you should target 5-10% stop rate, i.e. about one in ten of your free visitors hit your reg wall during a month. But the survey showed that many publishers are achieving much higher stop rates – often 20%, 30% or 40%. And higher stop rates improve your conversion to registration.
A key factor here is how much of your higher value content you allow visitors to view anonymously before they hit the reg wall. A loose allowance is likely to result in a low stop rate.
How many of your free visitors convert to registration each month?
Registration rates can seem low – many publishers only see 0.2% or 0.5% of free visitors converting each month. But this adds up over a year. Some publishers converted over 1% a month – one got as high at 5%. If over a year you are converting 12% or more of your free visitors to registered users then you are building a strong email database. As well as supporting paid digital subs, this is invaluable for marketing live and virtual events.
How many pages do your registered users view a month?
This measure varies a lot by market. In more niche B2B sectors the content is highly relevant and hard to find, so readers are satisfied with a smaller number of articles. In the survey the monthly allowance of articles ranged from 3 to 10 per month. If your allowance is too generous, most registered users won’t ever hit the paywall. Which brings us on to the next measure.
How many of your registered users hit your paywall each month?
This stop rate is a key measure if you are serious about building paid digital subs. Those publishers in our survey with a stop rate below 10% saw very low subscription rates. Again, some publishers have very impressive stop rates for their paywall – as high as 30% or even 50%. So do consider whether your registered user allowance is too generous. Or have some premium content that registered users can’t access at all and causes them to immediately hit the paywall.
How many of your registered users convert to a paid sub each month?
This is a crucial measure. Most publishers achieve a fairly low proportion: 0.2% to 0.5% per month but of course this adds up over a year. A couple of publishers in the survey did much better, reaching 5% or even higher. Unsurprisingly, these were the publishers with much better stop rates (over 40%).
Price is a key factor here. A trial offer along the lines of £4 for 4 weeks or £12 for 12 weeks makes all the difference to your paid subscriber conversion rate. Yes, you will need to convert them to full price at the end of the offer, but if your content is good that should be possible, and you may well find that the lifetime value of a trial offer is greater than a fixed price point. Most publishers these days offer a monthly price as well as annual.
What is your renewal rate?
Typical annualised renewal rates were in the range 70-80%, with value renewal rates 5-10% higher. A couple of publishers were more at the 50% mark. This may be because people move in and out of your market quickly, but if not, this should be a key focus: are you delivering value for money? Can you win back lapsed subs with a targeted offer?
More insights on benchmarks for registration and subscription.
The survey is still open. If you want to share your data here is the link. All who complete a full survey will receive an anonymised summary of their peers, split by consumer and B2b.
Do also read the article based on the 2022 registrations and subscription benchmarks survey
Join the Speciall Media Group for more best practice and discussion of publishing topics including registrations and subscriptions with 250 other media and publishing leaders. It’s free (for now) but invite only, no vendors or suppliers.
If you’d like to discuss how you can improve your own conversion to digital registrations and subscriptions then get in touch for an initial chat.
About the author
Carolyn Morgan has acquired, launched, built, and sold specialist media businesses in print, digital and events. She now advises niche consumer and B2B publishers on developing new products and digital revenue streams as a consultant and NED.
Find out more about the advice we provide for publishers